Search Research Library:
Research Library
Publication
Chronobiologically Interpreted Ambulatory Blood Pressure Monitoring (C‑ABPM) in Every Home
Abstract
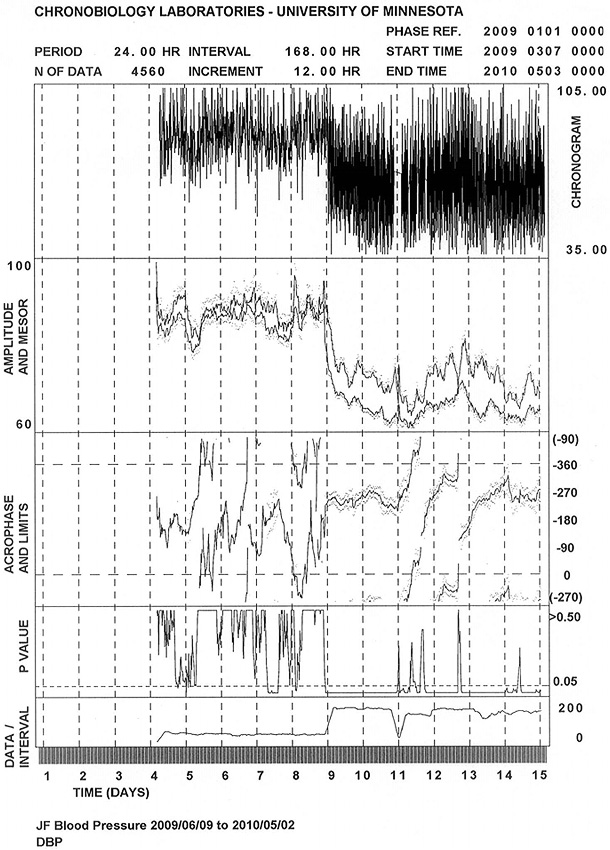
We compare the same person’s (JF) 5 months of around-the-clock self-measurements with subsequent ABPM (lunar cycles 9-15) and find with the latter, not with the former, a novel diagnosis of alternating societal synchronization and desynchronization of blood pressure (BP) and heart rate (HR) that cannot be made with a 24-or 48-hour ABPM or with systematic home measurements. Reliance upon a BP cuff in a provider’s office is not justified; they can give erroneous rhythm characteristics and result in misdiagnoses. Figure 1 presents a serial section with the analysis of 5 initial months of self-measurements at about (~) 3-hour intervals followed by a span of similar length involving automatic measurements, with an instrument from Spacelabs (Issaquah, Washington, USA). The self-measurements were by JF, a 62-year-old selenosensitive woman with a history of winter and summer adynamias each lasting 2-3 months for 20 prior years. During the fourth lunar month of her systematic self-ratings, she started BP and HR self-measurements and in the 9th lunar month she switched to ABPM. A glance at the original data concerning diastolic BP reveals the overall much lower automatic values in the top row of the figure starting with lunar cycle 9. The nightly values are largely missing in self-measurements. In the second row, the lower curve is the MESOR (M), a midline-estimating statistic of rhythm, and the distance from the curve to the dots below the curve corresponds to 1 standard error of the M. The distance between the M-curve and the upper curve in the second row represents an amplitude (A), an objective measure of one-half of the extent of within-day change, and the distance between the upper curve and the dots above it represents 1 SE of A. A marked increase in the area between the two curves starting with cycle 9, when automatic measurements began, shows the increase in A. In turning to phases, f, during cycles 4-8 inclusive, they are highly variable in row 3 of this graph, in which the acrophase is doubly plotted whenever it nears midnight, corresponding to 0 (one midnight) and to 360 degrees (the next midnight). Relatively few dots are seen around the acrophase, representing CIs (95% confidence intervals) before lunar cycle 9, whereas the bracketing dots are present most of the time in the following cycles, in keeping with the information in the row of P-values. In this fourth row, the dashed horizontal line represents 5%, the bottom line being the 1% and lower level. Before cycle 9, many P-values are cut off since they are above the 0.5 level, and most of them are above the 0.05 level. By contrast, rhythm detection, mostly not feasible by the method used in cycles 4-8 inclusive, is invariably present at or below the 1% level in cycles 9 and 10, during which the horizontal time course of acrophases shows frequency synchronization. All P-values are below the 0.5 level in these two cycles; the vast majority are at or below the 1% level when the rhythm phases start a delaying time course which continues through the next 3 cycles, 11-13, showing frequency desynchronization. In this case of JF, most of the time there was no rhythm detection with self-measurements by a highly motivated subject; by contrast a clear demonstration of circadian rhythmicity was possible with automatic instrumentation with the data interpreted chronobiologically by a serial section (and by monthly summaries in spectral windows, not shown). The estimates for M, A and phi were much more variable in self-measurements than in automatic measurements. Conclusion. For a reliable detection of frequency desynchronization, manual measurements during waking only, by a highly motivated person, are too variable to be reliable. A chronobiologically interpreted C-ABPM over appropriate spans, in this case months not weeks, becomes essential. The need to replace the cuff in the physician’s office with C-ABPM in each home as well as in providers’ offices was obvious to Zadek, Janeway and Bartter, but not possible then; such replacement becomes feasible in 2010. The authors are indebted to Jon Clark of Spacelabs (Issaquah, WA) for the instrumentation used.

Figure 1.
JF Blood Pressure – 2009/06/09 to 2010/05/02 DBP
A serial section with the analysis of 5 initial months of self-measurements at about (~) 3-hour intervals followed by a span of similar length involving automatic measurements, with an instrument from Spacelabs (Issaquah, Washington, USA).

