Researching Heart-Brain Coherence and Global Interconnectedness
HeartMath Institute researches heart-brain communication, HRV coherence, and stress management while exploring how all living systems interconnect. Our scientists study the electrophysiology of intuition, the heart’s electromagnetic field, and how Earth’s magnetic fields affect human health and behavior. Through our Global Coherence Initiative, we monitor geomagnetic fields, solar influences, and collective human consciousness—revealing our profound connection to each other and our planet.
InterconnectivityResearch
Our global interconnectivity research is illuminating just how important a role we can all play in uplifting and unifying the collective global field environment.
Research Sections

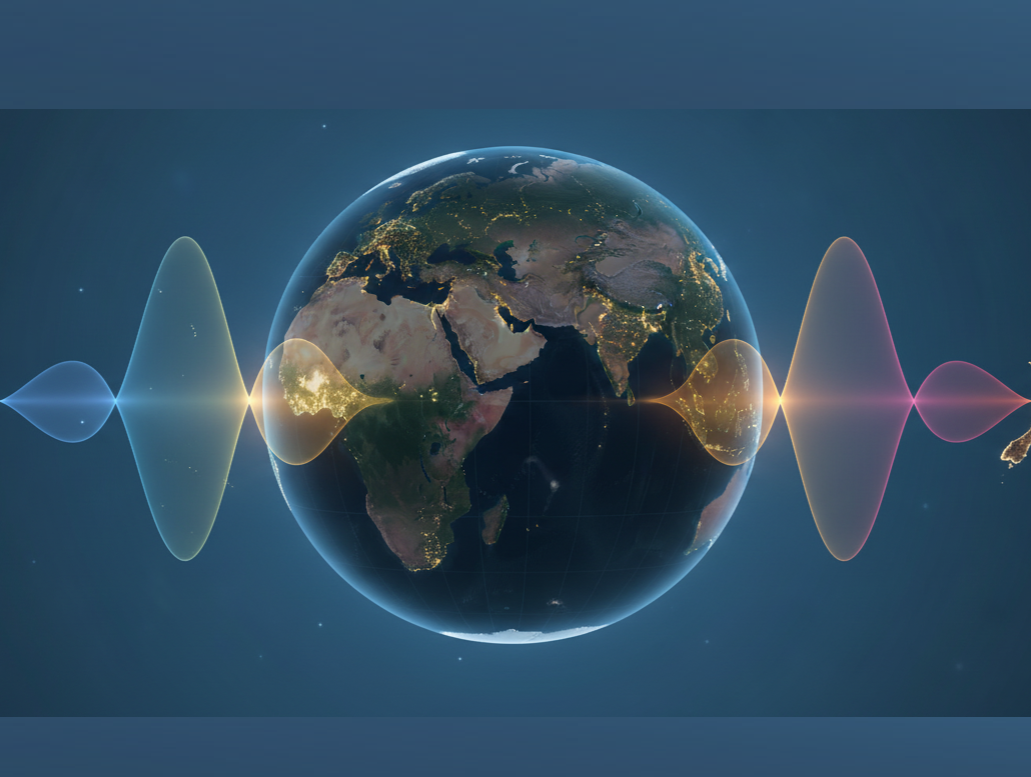
Global Coherence Initiative
& The Science of Interconnectivity
Global coherence research encompasses a large variety of scientific data to gain new insights into the interconnectedness of human/animal health and behavior and the sun and earth’s magnetic activity. The scientific community is just beginning to appreciate and understand the deeper level of how we are interconnected.
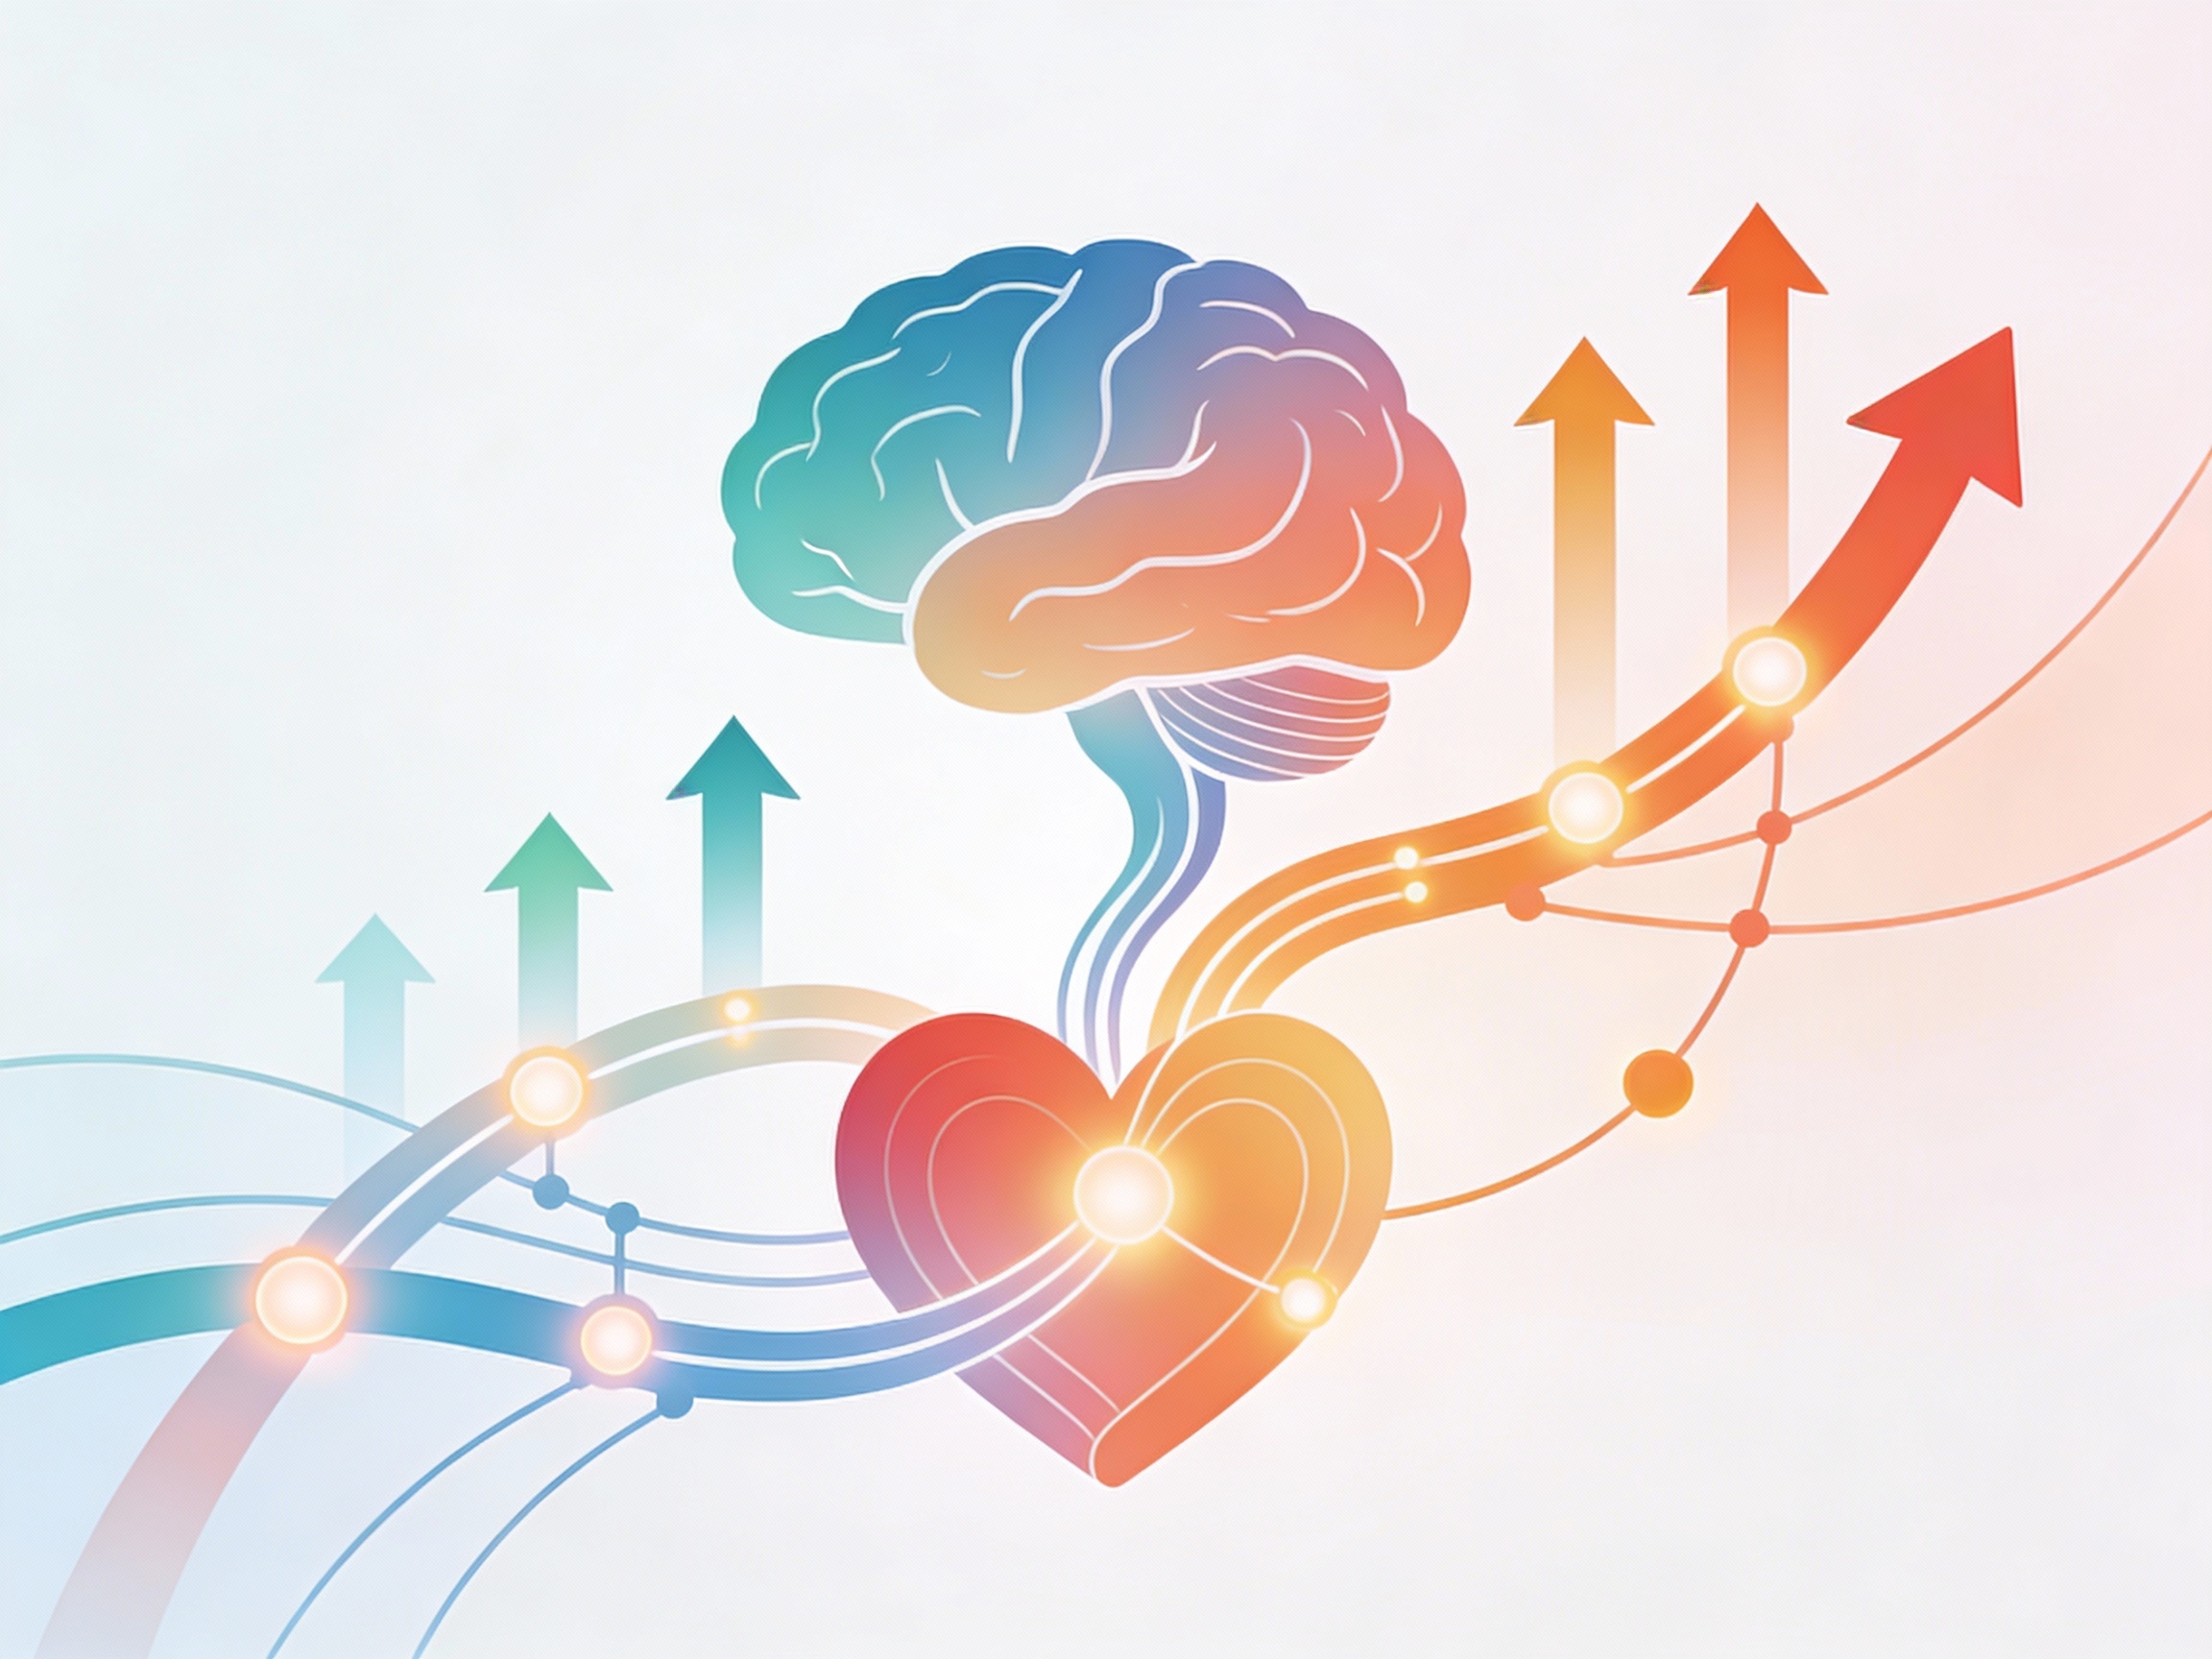
Heart Coherence
A comprehensive look at the HeartMath Institute’s findings on the science of heart-brain communication, intuitive intelligence and optimal functioning.
Research Library
Browse many HeartMath Institute and independent research studies here, including stress reduction, improving health, heart-rate variability, intuition and energetic communication.
Featured Research Papers
Global Coherence
Global Study of Long Term Heart Rhythm Synchronization
Global study reveals long-term heart rhythm synchronization in Saudi Arabia and New Zealand groups, suggesting social closeness influences cardiac patterns.
Educational Research
Experimental Evaluation of a Neurophysiological Intervention…
A pilot study of Smart Brain Wise Heart Social and Emotional Learning intervention showed promising results for students with lower academic achievement, improving resilience and mental health.
Basic Research
Following the Rhythm of the Heart…HRV Coherence Biofeedback
This paper covers the lab’s contributions to heart rate variability research, including biofeedback for stress reduction and performance enhancement, with future directions explored.
Science of the Heart (Free)
New research shows the human heart is much more than an efficient pump that sustains life. Our research suggests the heart also is an access point to a source of wisdom and intelligence that we can call upon to live our lives with more balance, greater creativity and enhanced intuitive capacities.
Featured Heartmath Projects

GCP 2.0
GCP 2.0 is a data-driven global experiment designed to study how human consciousness (attention and emotions) correlates with changes in global consciousness and the physical world.

Tree Research
HMI scientists want to understand the role trees play in the discovery and aim to demonstrate how trees, people, nature and all living systems are interconnected in unseen and dynamic ways.