
Search Research Library:
Research Library
Publication
The Physiological and Psychological Effects of Compassion and Anger
Abstract
Salivary IgA, heart rate and mood were measured in thirty individuals before and after experiencing care or anger. Two methods of inducing the emotional states were compared: self-induction and external induction via video tapes. Anger produced a significant increase in total mood disturbance and heart rate, but not in S-IgA levels. Positive emotions, on the other hand, produced a significant increase in S-IgA levels. Examining the effects over a six hour period we observed that anger, in contrast to care, produced a significant inhibition of S-IgA from one to five hours after the emotional experience. Results indicate that self-induction of positive emotional states is more effective at stimulating S-IgA levels than previously used external methods. Self-induction techniques may therefore be useful in minimizing the immunosuppressive effects of negative emotions.
Introduction
Salivary immunoglobulin A (S-IgA) is the predominant antibody class in mucosal secretions [1], provides the first line of defense against pathogens in the upper respiratory tract, the gastrointestinal system and the urinary tract [2], and is frequently used as a measure of secretory immunity. Higher levels of S-IgA are associated with decreased incidence of disease and susceptibility to upper respiratory infections [3, 4].
Although it is well known that psychosocial factors, including major stressful life events, produce detrimental effects on a variety of immune functions [5], most studies do not distinguish specific affective states from a generalized stress response. Minor stressors associated with negative daily life events affect mood [6, 7] and, somewhat surprisingly, minor mood fluctuations are more strongly correlated with disease than major stressors [8]. Emotions and moods have been studied with respect to their effects on the immune system [5] and on the frequency, severity and susceptibility to diseases [9, 10].
Reduced levels of S-IgA are seen following a variety of psychosocial factors including stressful life situations, withdrawal of social support [11] and negative emotional states like bereavement [12], anxiety [13] and the need to have power and to influence others [3, 14]. Immunosuppresive effects of negative emotions have also been reported in terms of decreased lymphocyte proliferation [15] and an inhibition of natural killer cell activity [16].
In contrast, relatively few have investigated the effects of positive emotions on the immune system. Stone [17] studied normal affective states by measuring daily fluctuations in mood and observed a correlation between the days when individuals experienced positive moods and elevated S-IgA levels. Previous studies on the positive emotions of happiness and joy have reported conflicting results with some investigators observing immunoenhancement [18-20] while others observed immunodepression [15] or no change in immunity [15, 21].
Another approach to studying positive emotional states is the use of individuals with loving and caring psychological characteristics. These qualities, referred to as affiliative motivation, are defined as a desire to establish and maintain warm relationships with others. Individuals receiving adequate social support show greater affiliative tendencies [22], have less life stress [22], show smaller increases in stress hormones following stress [23] and are less likely to get ill [3, 24]. Such individuals also tend to show increased natural killer cell activity [16] and increased S-IgA, even when stressed [11, 25]. McClelland and Kirshnit [26] reported that affiliative qualities could be induced in subjects by having them watch a video of Mother Teresa’s work with the dying in India after which an immediate increase in S-IgA levels was observed.
The purpose of this study was to verify the immediate effects of positive and negative emotions on S-IgA and to examine effects over a 6 hour period. We were also interested in comparing the more traditional method of externally inducing emotions, by having the subjects watch selected videos, with a newly developed stress-management technique which trains subjects to self-induce and experience genuine, heart-felt emotions in themselves. We also studied the short-term time course of S-IgA levels after an emotional experience to test the hypothesis that maximal changes in S-IgA occur during or immediately after experiencing emotions.
Methods
Subjects
A total of thirty subjects, 13 male and 17 female, were randomly assigned to the various subgroups used in this study. All subjects were in good health and were free from respiratory symptoms, colds and headaches. The age of the subjects varied between 17 and 50 (mean=38). All individuals maintained the same work schedule, sleep cycle, social environment and diet. None of the subjects were currently taking prescription drugs and for at least 8 hours prior to each testing period, subjects refrained from smoking, exercising, eating or drinking anything except water. All subjects were trained in a stress management technique called Freeze-Frame which has previously been described in detail elsewhere [27].
Experimental Design
All experiments were started at 10 a.m. to minimize diurnal variations. A preliminary study was designed to test for the different effects of self-induced (Freeze-Frame) and externally-induced (video tapes) emotions on S-IgA. Twenty of the subjects were randomly divided into four groups with five individuals in each group. Two of the groups were asked to experience care and/or compassion (C&C), and the other two anger and/or frustration (A&F). The two groups were tested on two separate occasions with two days between each experiment. Self-induced and external induction methods were used for both the C&C; and the A&F; groups. The self-induced method was more effective in inducing the emotional states and stimulating S-IgA levels and was therefore used in the main study designed to determine the long term effects of A&F; and C&C; on S-IgA levels. In the main study subjects were age and sex-matched and were randomly assigned to three groups of ten individuals each. One group experienced A&F, the second group C&C; and the third group acted as a control. All individuals from each group were tested on a single day and all three groups were tested within a seven day period.
In the preliminary study unstimulated whole saliva samples were collected in a graduated cylinder for a 4 minute collection period according to the procedure of Kerr [28]. Saliva samples were collected on arrival at the lab and after a 15 minute rest period. The difference between these two samples was used as a relaxation effect control. Subjects were given instructions to sit quietly and not to intentionally alter their emotional state during the rest period. Subjects were then asked to fully experience a specific emotional state for a 15 minute period. At the end of this period an additional 4 minute saliva sample was collected and the subjects completed a self-report questionnaire designed to assess the level of emotional arousal. Saliva samples were frozen within one hour of collection and stored in liquid nitrogen.
For the main study, subjects were asked to experience the emotional state for a 5 minute period. On arrival each subject was wired for ECG monitoring. Unstimulated whole saliva samples were collected immediately before and after the emotional stimuli. In addition, samples were collected with different saliva flow collection times in order to determine if longer collection times masked the S-IgA response during emotional expression. A 0.25 ml sample (corresponding to 15 seconds), a one-minute sample and a three minute sample were collected for baseline values. Immediately after the emotional experience, an additional 0.25 ml sample and four sequential one-minute samples were also collected. The first one-minute sample of this sequence was compared with the one-minute baseline sample. The four sequential one-minute samples where then averaged and compared with the averaged value obtained by adding all of the one-minute baseline samples.
In addition to these samples, 0.25 ml samples were collected at hourly intervals over a 6 hour period starting one hour after the emotional experience. A fixed volume of 0.25 ml was chosen as the average volume collected in a 15 second time period because it was more convenient to have subjects fill the saliva to a marked level in a test tube.
Subjects in the control condition were not given instructions relating to their emotional state. Unstimulated saliva samples of 0.25 ml were collected before and after listening to a balanced selection of emotionally neutral music for 5 minutes.
Inducing Emotional States
C&C; and A&F; were chosen as representative positive and negative emotional states. For both cases, participants were asked to experience the emotions at as deep a feeling level as possible. Feelings of care and compassion were induced by two different methods: intentionally self-inducing the feelings and externally stimulating them with video tapes. In order to facilitate the self-induction method a technique called Freeze-Frame was used. This technique allows participants to consciously disengage from mental and emotional reactions to external or internal events by shifting their attention to the physical area around the heart, where most people subjectively feel positive emotions, and focusing on feelings of care or compassion toward someone or something [27, 29, 30]. In the external method of inducing positive emotions, participants were asked to freely experience all emotions felt when watching a video tape of Mother Teresa, a Roman Catholic nun caring for the diseased and dying in the slums of Calcutta.
Negative emotional states were induced by self-recall and video stimulation methods. Self-induced emotions were accomplished by asking subjects to recall situations in their own lives which arouse feelings of anger and/or frustration. Subjects were asked to recapture and maintain the feelings as best they could. In the second method participants were instructed to experience all emotions aroused while watching a specially edited video of war scenes similar to the one used by McClelland [26].
Psychological Testing
In the preliminary study, a self-report questionnaire was used for mood assessment which consisted of seven questions designed to determine the intensity and duration of the emotional states. Intensity was quantified on a 10-point scale from 1="very weak" to 10="very strong," and duration was quantified as a percentage of the total experimental period the emotion was felt. Mean mood scores were calculated by multiplying the intensity of the feelings by the duration of the emotion. Higher mean mood scores reflect a deeper emotional experience. A second questionnaire asked for a qualitative description of other emotions experienced and for the presence of physical symptoms. Both questionnaires were given immediately after the experimental period. The qualitative questionnaire was also completed in the long term study at hourly intervals throughout the day.
In addition to these questionnaires, mood changes were assessed in the long term studies using the Profile of Mood State (POMS) test (EdiTS/Educational and Industrial Testing Service, San Diego, CA) which is designed to measure transient affective states. POMS tests were taken immediately before and after experiencing the emotional states. All subjects rated the extent to which a variety of adjectives (65 in all) described their present mood state. Each adjective was rated on a 5-point intensity scale from "not at all" to "extremely." The total mood disturbance (TMD) score was calculated as the sum of the scores for each of the six primary moods. According to the POMS manual, all moods, except vigor, were assigned a negative score. Higher scores indicate greater mood disturbance.
Heart-Rate Determination
Ag/AgCl disposable electrodes were used for all bipolar ECG measurements. The positive electrode was located on the left side at the 6th rib and the reference was placed near the top of the chest just under the neckline. Grass model 7P4 amplifiers were used for ECG amplification. All data were processed by a 16 channel, 16 bit digitizer in conjunction with the software of the Bio Pac system [31]. ECG measurements were recorded for a 15 minute baseline establishment period, during the test period and for 15 minutes after the emotional experience in all experiments.
S-IgA Determinations
Saliva samples were assayed for IgA concentration by the single radial immunodiffusion method of Mancini et al. [32] and made commercially available by Binding Site Inc. Although there is some debate about the accuracy of the various methods available to measure S-IgA, we chose the radial immunodiffusion method to allow direct comparison with previous studies examining the effects of emotional states. Aliquots of saliva (5ul) were diluted 1:2 (v/v) in phosphate buffered saline and placed in the cylindrical wells of agarose gel plates impregnated with monospecific sheep anti-human S-IgA (Binding Site, San Diego, CA). Each plate also contained a reference standard of 100 mg/L purified human serum S-IgA (Binding Site, San Diego, CA). After a 72 hour incubation at 20¡ C, the precipitation reaction was complete and the diameter of the ring was measured using an 8X ocular micrometer to an accuracy of 0.1 mm. All measurements from the plates were the average of two separate readings by two readers which varied between 0 and 10%. S-IgA concentration values were read from a standard curve obtained using purified human serum S-IgA. Variations between agar plates were determined by normalizing all values to the reference standard. All S-IgA values were multiplied by 3.25 according to Brandtzaeg [33] to correct for the sedimentation coefficient value of S-IgA. S-IgA concentration is expressed as mg/dL.
Statistical Analysis
Raw data from the preliminary study were analyzed for statistical significance using the Wilcoxon sign-ranked repeated measures test. A one-tailed analysis was used for comparing positive emotions since previous studies predicted only increases in S-IgA. Two-tailed analyses were used with all other statistical analysis. Raw data from the main study were analyzed for overall significance using a 2 x 2 repeated measures analysis of variance (ANOVA) to test the immediate effects of positive and negative emotions on S-IgA levels. The effect of each emotional stimuli on S-IgA was then analyzed using a one-way ANOVA test. The long term results were analyzed for overall significance using the Friedman repeated measures analysis of variance by rank and using the Wilcoxon sign-ranked test for significance at hourly intervals.
Results
Psychological Data: Preliminary Study
Results from the self-report questionnaires and from heart rate measures of participants watching the war video indicated non-uniform responses with a wide variety of emotions being expressed. Females, for example, experienced compassion rather than anger during certain scenes involving children. Some individuals (40%) did not feel angry and, amongst those who did, the feelings were short-lived. The physical symptoms reported by all individuals were described as light to medium tension or irritation in the stomach. Group mean heart rate did not significantly increase. The mean mood score for the group was 315 ± 302. In contrast, results from the self-induction of A&F; group showed more consistency. All individuals experienced anger with no conflicting positive emotions reported, however, some individuals also reported feelings of frustration or resentment. The mean mood score for this group of 616 ± 199 was not significantly different (t=2.13, p>0.05) from the video group. The physical symptoms were typically described as a knot in the stomach and one individual developed tears. The results indicate that recall of negative emotions produces a more intense emotional experience than watching videos and was therefore used in the subsequent long-term study.
Results from the two groups experiencing C&C; were similar. Care and/or compassion was experienced by 90% of individuals in both groups. Most individuals could not distinguish feelings of care from those of compassion. The mean total mood scores were also similar in both groups: 543 ± 180 for the video group and 510 ± 251 for the self-induction group. No unpleasant physical symptoms were reported by either group. In order to maintain consistency with the self-induction of anger, the self-induction method was also used in the long-term study to induce positive emotional states.
S-IgA Data: Preliminary Study
The results in Figure 1 below indicate that both feelings of C&C; and A&F; caused an increase in S-IgA immediately after the emotional experience as compared with the control group. The data is normalized to facilitate comparison between groups.
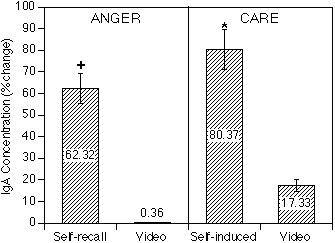
Figure 1.
IgA Concentration
Results indicate that both feelings of C&C; and A&F; caused an increase in S-IgA immediately after the emotional experience as compared with the control group. The data is normalized to facilitate comparison between groups.
The Physiological and Psychological Effects of Compassion and Anger Research paper- Figure 1 anger-care The Physiological and Psychological Effects of Compassion and Anger Research paper- Figure 1 anger-care The effects, however, were dependent on the method used to generate the different emotional states. The self-induced anger group had a significant increase in S-IgA levels (z= -2.02, p0.05) whereas the war video group did not (z=-0.37, p>0.05). In the case of C&C, both methods resulted in increased S-IgA levels, although only the self-induced group produced significant effects (z= -1.83, p0.05). In the self-induced C&C; group 80% of the individuals showed increased levels of S-IgA while only 60% of the A&F; group showed increases. Analysis of the control group showed no significant differences in S-IgA levels (t=0.89, p>0.05) before and after the relaxation period.
Effect of Emotional States on S-IgA Concentration
Based on the results from the preliminary study, we compared the effects of self-induced feelings of C&C; and A&F; using a larger (n=10) population with the effects of a music control group. Subjects were asked to experience emotional states for a 5 minute period since results from the preliminary study indicated most subjects had difficulty in maintaining these states for longer periods. The results in Figure 2 (for 0.25 ml saliva samples) indicate an increase in S-IgA concentration immediately after experiencing either positive or negative emotions, 18% for the A&F; group and 41% for the C&C; group as compared with the music control group which had a 12% increase. ANOVA analysis revealed that the main time effect, representing the overall before and after differences for both groups, was significant, F(1,18) = 10.81 (p0.01). The main interaction effect (condition x time), however, did not reach statistical significance, F(1,18) = 0.42 (p>0.05). Comparing the two emotional expression groups using a one-way ANOVA repeated measures test indicated a significant increase in S-IgA immediately after C&C, F(1,9) = 6.34 (p0.05), although the increase following A&F; was not significant, F(1,9) = 4.48 (p>0.05). Analysis of before and after differences for the music control group indicated no significant changes in S-IgA levels, t=0.41 (p>0.05).
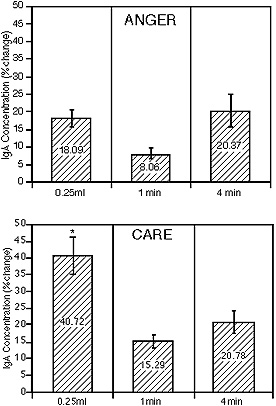
Figure 3.
Effects of C&C; when different saliva collection periods were used.
Comparing the effects of C&C; when different saliva collection periods were used. Although a significant increase in S-IgA levels was observed with the 0.25 ml samples (collected over 15 seconds), changes in S-IgA levels after C&C; did not reach significance for either one minute or four minute sample collection times.
The long-term effects are presented in Figure 2 above. Analysis of variance by rank revealed that the overall effect of before and immediately after the emotional experience for both groups was significant x2 (6) = 22.32 (p 0.01). Using the Wilcoxon sign-ranked test for the different groups, a significant decrease in S-IgA levels was observed for the first five hours after the participants experienced A&F, with levels returning to baseline at the sixth hour. In contrast, S-IgA levels one hour following C&C; were not significantly different than baseline levels, although there was a gradual tendency toward increased levels throughout the six hour period.
The results in Figure 3 below compare the effects of C&C; when different saliva collection periods were used. Although a significant increase in S-IgA levels was observed with the 0.25 ml samples (collected over 15 seconds), changes in S-IgA levels after C&C; did not reach significance for either one minute or four minute sample collection times.
The Physiological and Psychological Effects of Compassion and Anger Research paper- Figure 3 anger-care We suspected that these differences might be explained if S-IgA secretions predominantly occurred during and shortly after the emotional experience and that continued collection of saliva diluted the S-IgA levels. The results in Figure 4 below showing the sequential one-minute samples support this conclusion and indicate a continual decrease in S-IgA concentration over the four minute time period. Samples collected during the second, third and fourth minutes showed significantly lower S-IgA concentrations than the original starting value, decreasing by 17.7% (z = -3.06, p 0.01), 31.6% (z = -3.92, p 0.001) and 39.5% (z = -3.92, p 0.001) respectively. Furthermore, this decrease in S-IgA was independent of the volume of saliva which did not continually decrease and in some individuals even rose during the 4 minute time period (data not shown). These results indicate that the magnitude of the increase in S-IgA immediately following the emotional experience gradually decreases when longer collection periods are used.
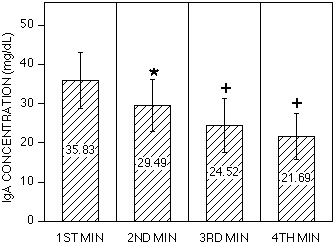
Figure 4.
IgA Concentration
Sequential one-minute samples indicate a continual decrease in S-IgA concentration over a four-minute time period. Samples collected during the second, third and fourth minutes showed significantly lower S-IgA concentrations than the original starting value.
Psychological Changes
The results of the POMS tests Figure 5 below indicate a marked shift in the current psychological mood of individuals experiencing emotional states. The mean TMD scores for the C&C; group decreased significantly by 19 points (z = -2.70, p 0.01), and the scores for the A&F; group significantly increased by 95 points (z = -2.80, p 0.01). These results are consistent with the hypothesis that negative emotional states increase mood disturbance, whereas positive states decrease mood disturbance. The individual POMS factors, also presented in Figure 5, indicate significance in all before and after differences, except for the decrease in the depression-dejection factor in the C&C; group. Thus, the C&C; group experienced dramatic decreases in tension-anxiety, anger-hostility, fatigue and confusion as well as an increase in vigor. The A&F; group, on the other hand, experienced the exact opposite. These findings are further validated by results obtained from the self-report questionnaires. The mean mood score of 654 ± 166 for the group experiencing C&C; was statistically higher (t=1.83, p < 0.05) than the score of 400 ± 243 for the A&F; group. These results indicate that the feelings of C&C; were experienced more intensely and for longer duration than the feelings of A&F. The questionnaires also indicated that other emotions were also experienced in the two groups. Thus, the C&C; group reported feelings of love, appreciation and tranquillity; whereas the A&F; group felt frustration, aggravation and resentment. Furthermore, the A&F; group reported a variety of physical symptoms including headaches, indigestion, muscle pains and fatigue. The only physical symptom reported by the C&C; group was that of relaxation.
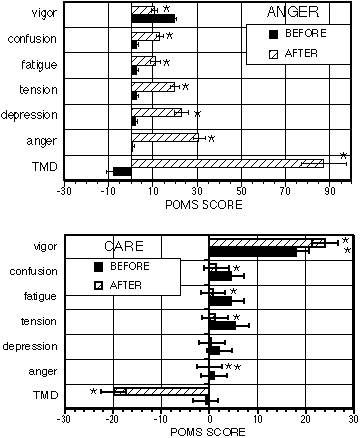
Figure 5.
Current psychological mood of individuals experiencing emotional states.
The results of the POMS tests indicate a marked shift in the current psychological mood of individuals experiencing emotional states.
Heart rate changes
Heart rate increased from 65.3 ± 8.7 to 69.3 ± 8.4 while experiencing A&F. Using a one-way ANOVA analysis this effect was significant, F = 30.23 (p 0.01). The slight increase in heart rate from 61.2 ± 5.3 to 62.8 ± 4.8 while experiencing C&C, however, did not reach significance, F = 1.65 (p > 0.05).
Discussion
One of the main findings from this study is the demonstration that a 5 minute period of experiencing C&C; immediately produced a significant increase in S-IgA levels, while A&F; did not. These emotional states can be further distinguished by measuring effects over several hours, since S-IgA levels remained low for five consecutive hours after A&F, whereas after C&C; they returned to baseline after one hour. Immediate effects were more pronounced when emotions were self-induced as compared to the external video method.
These increased S-IgA levels were more visible when saliva samples were collected over shorter time periods, in contrast to the longer collection times used in some previous studies. In general, samples collected with longer collection times had lower S-IgA concentrations than those collected over shorter times and this effect was independent of the saliva volume. Previous studies demonstrating the effects of stress on S-IgA levels observed similar results whether or not saliva volumes were taken into account [11, 26]. Based on the results of the present study we believe that measurements taking into account saliva volume are adding a confounding variable, when the main physiological event of interest is the actual amount of S-IgA secreted by the salivary glands during or immediately after an emotional experience. The 15 second collection times used in this study allowed measurement of this event. The decrease in saliva flow during stress and negative emotional states [34] was not the main area of interest in this study. Some previous studies may have missed the S-IgA response to emotions by diluting the effects with longer saliva collection times.
Although the increased S-IgA levels reported here immediately following feelings of anger did not reach significance, a significant increase in heart rate and mood disturbances along with a variety of physical symptoms including headache, dry mouth and muscle pains was observed. These symptoms typically lasted for 3 hours after the initial experience of anger and in some cases persisted for 6 hours. It is interesting to note that the time period of uncomfortable symptoms closely parallels the decrease in S-IgA levels. This confirms previous studies which report cardiovascular [35] and mood [36] disturbances in association with anger and anxiety.
It is also likely that the changes observed here were specifically due to the emotional intervention, although possible interactions between the intervention and other psychosocial factors like life style and menstrual cycle times cannot be ruled out. These factors are likely to contribute to baseline shifts between groups, but are unlikely to affect S-IgA changes immediately following emotional experiences. Individual differences associated with diurnal variations were minimized in this study by testing all individuals at the same time of day. Previous studies which have measured S-IgA concentrations during stressful periods have compared S-IgA values on different days without taking into account circadian variations [11, 14, 23].
The effects of A&F; on S-IgA reported here are similar to those obtained by McClelland et al. [23] who observed nearly significant increases in S-IgA and norepinephrine after college students completed a stressful exam. The McClelland study supports others demonstrating sympathetic activation in association with stressors [37] using power spectral analysis of heart rate variability to assess sympathetic regulation of heart rate. The observation of increased heart rate during anger supports our previous observation of increased sympathetic activity, as measured using power spectral analysis, during anger [38]. These results in conjunction with the self-report questionnaires indicate that subjects genuinely experienced anger. Our previous study [38] also demonstrated that the positive emotion of appreciation, generated by the self-induction technique used in the present study, increased parasympathetic activity. Increased autonomic activity associated with emotional states provides a mechanism to explain immediate changes in S-IgA levels, since the salivary gland is innervated by both the sympathetic and parasympathetic nervous systems and adrenergic neurotransmitters regulate exocytosis from this gland [39].
Most studies have examined immediate changes in S-IgA following emotional experiences. However, McClelland et al. [23] reported that after an immediate rise in S-IgA levels, they then significantly decreased one and three-quarter hours after a stressful episode. Biphasic immune responses have also been observed following i.p. injection of adrenaline [40]. A similar biphasic response to A&F; was observed in the present study thereby extending McClelland’s original observations [23]. The decreased levels of S-IgA remained significantly lower than baseline levels for five hours after the initial emotional experience of anger. These findings are even more significant when considered in the context of control data from previous circadian rhythm studies [41, 42] demonstrating marked increases in S-IgA concentrations from noon to 6 PM, the time course used in the present study [38, 43].
These findings may explain previous inconsistent results of IgA levels following emotional stimuli since post stimuli times are so varied. These findings also offer an insight into a possible neuroendocrinological mechanism to explain the long-term immunosuppression associated with emotional stressors. Aldosterone [44] and neuropeptides [39, 45], known to be elevated in stress, have direct actions on salivary glands. These results have important implications considering the frequency of stressful emotions many people experience and the apparent long-term immunosuppressive effects of these emotions.
It is interesting to note that both positive and negative emotional states caused an immediate increase in S-IgA, although the increase with anger was not significant. Similar results have been obtained by other investigators who have directly compared positive and negative emotions, e.g., Knapp [15] observed similar decreases in lymphocyte proliferation and Futterman [21] observed similar variability in a variety of immunological parameters. On the other hand, some investigators have obtained opposite immunological effects with positive and negative emotions [17, 20]. The results of this study indicate that the amount of time elapsed between the emotional experience and the immunological measure is critical and may explain the variable results in the literature. The increased S-IgA levels reported here in response to positive emotions may be partly due to relaxation since we as others [46] observed a trend toward increased S-IgA following a neutral, resting period. Nonetheless the effects observed here using self-induction techniques to induce positive emotional states are significantly greater than those due to a generalized relaxation state.
The self-induction technique used in this study produced relatively large increases in S-IgA which were as high as 240% in some individuals. These relatively large immunoenhancing effects may be explained by the Freeze-Frame technique used which focuses on heart-felt feelings associated with genuine, real time emotions. This method is therefore distinct from other techniques such as actors playing out emotional states or recall techniques which focus on the mental/imagery components of emotional experience.
Results from this study indicate that self-induction of a positive emotional state is more effective at stimulating S-IgA than external methods. In a previous study we observed that feelings of appreciation generated by the Freeze Frame self-induction technique increase parasympathetic activity as measured by power spectral analysis of heart rate variability [38]. Since salivary secretion is primarily activated by parasympathetic nerves, autonomic regulation offers a possible mechanism to explain the immediate increases in S-IgA following positive emotions. In addition to feeling care and compassion, the Freeze Frame technique also induced a general state of well being, feelings of relaxation, and increased energy which often lasted throughout the day. The clinical application of such positive emotional states has been demonstrated with HIV+ individuals who showed dramatic improvement in a variety of psychological tests following a six-month intervention program incorporating the Freeze Frame technique [43].
Conclusion
Salivary IgA, heart rate and mood were measured in thirty individuals before and after experiencing the emotional states of care and compassion (C&C) and anger and frustration (A&F). Emotional states were aroused either by a specially developed stress-management technique (internal) or by showing participants video tapes (external).
Increases in S-IgA after A&F; were only seen using the self-recall technique. A significant increase in total mood disturbance was observed, as well as an increase in heart rate. An immediate increase in S-IgA after a 5 minute period of anger was followed by a large decrease which was sustained for an additional five hours. Self-induced feelings of care produced significantly larger increases in S-IgA than external induction techniques while a concomitant decrease in total mood disturbance was observed in both methods. In contrast to anger, the immediate increase in S-IgA following care was not followed by a decrease in S-IgA levels. Instead a tendency toward increased levels was observed over the following six hours.
A non-linear relationship between saliva flow rates and S-IgA concentration was observed using sequential one minute samples. In addition, before and after differences of the effects of emotional states on S-IgA concentrations indicate that shorter collection times are more informative. The results confirm and extend previous studies which have also investigated the immunoenhancing effects of positive emotional states. These results indicate the need for effective management of the long term immunosuppressive effects of negative emotions.
References
- Mims C. The Pathogenesis of Infectious Disease. New York: Academic Press, 1982.
- Tomasi T. The Immune System of Secretions. New Jersey: Prentice Hall, 1976.
- McClelland D, Alexander C and Marks E. The need for power stress, immune function and illness among male prisoners. J Abnorm Psychol 1980;10:93-102.
- Rossen R, Butler W and Waldman R. The protein in nasal secretion. JAMA 1970;211:1157-1161.
- Ader R, Felten DL and Cohen N. eds. Psychoneuroimmunology, Second Edition. 1991, Academic Press, Inc.: San Diego.
- Stone A and Neale J. The effects of severe daily events on mood. J Personal Social Psychol 1984;46:137-144.
- Rehm L. Mood, pleasant events and unpleasant events: two pilot studies. J Consult Clin Psychol 1978;46:854-859.
- Jandorf L, Deblinger E, Neale J and Stone A. Daily vs. major life events as predictors of symptom frequency: a replication study. J General Psychol 1986;113:205-218.
- Jemmott J and McClelland. Secretory IgA as a measure of resistance to infectious disease: comments on Stone, Cox DDS, Valdimarsdottir and Neale. Beh Med 1989;15:63-71.
- Stone A, Cox D, Valdimarsdottir H and Neale J. Secretory IgA as a measure of immunocompetence. J Human Stress 1987;13:136-140.
- Jemmott JB and Magloire K. Academic stress, social support and secretory immunoglobulin A. J Person Soc Psychol 1988;55:803-810.
- He M. A prospective controlled study of psychosomatic and immunologic changes in recently bereaved people. Chinese J Neurol & Psychiatry 1993;24:90-93.
- Annie C and Groer M. Childbirth stress-an immunology study. J Obst Gynecol & Neonat Nursing 1991;20:391-397.
- McClelland D, Floor E, Davidson R, et al. Stressed power motivation, sympathetic activation, immune function and illness. J Human Stress 1980;6:11-19.
- Knapp P, Levy E, Giorgi R et al. Short-term immunological effects of induced emotion. Psychosomatic Med 1992;54:133-148.
- Jemmott JB, Hellman C, McClelland DC, Locke SC, Kraus L and Williams RM. Motivational syndromes associated with natural killer cell activity. J Behav Med 1990;13:53-73.
- Stone A, Cox D, Valdimarsdottir H, Jandorf L and Neale J. Evidence that secretory IgA antibody is associated with daily mood. J Personal Social Psychol 1987;52:988-993.
- Zachariae R, Bjerring P and Zachariae C. Monocyte chemotactic activity in sera after hypnotically induced emotional states. Scand J Immunol 1991;34(7):1-9.
- Dillon KM, Minchoff B and Baker KH. Positive emotional states and enhancement of the immune system. Inter J Psychiat Med 1986;15(1):13-16.
- Labott S, Ahleman S, Wolever M, et al. The physiological and psychological effects of the expression and inhibition of emotion. Behavioral Med 1990;16:182-189.
- Futterman AD, Kemeny ME, Shapiro D, Polonsky W and Fahey JL. Immunological variability associated with experimentally-induced positive and negative affective states. Psychol Med 1992(22):231-238.
- Jemmott JB. Social motives and susceptibility to disease. J Personal 1987;55:267-293.
- McClelland DC, Ross G and Patel V. The effect of an academic examination on salivary norepinephrine and immunoglobulin levels. J Human Stress 1985;11:52-59.
- McClelland D and Jemmott J. Power motivation, stress and physical illness. J Human Stress 1980;6:6-15.
- Jemmott J, Borysenko Z, Borysenko M, et al. Academic stress, power motivation and decrease in secretion rate of salivary secretory immunoglobulin A. Lancet 1983;I:1400-1402.
- McClelland DC and Kirshnit C. The effects of motivational arousal through films on salivary immunoglobulin A. Psychological Health 1988;2:31-52.
- Childre DL. Freeze Frame®, Fast Action Stress Relief. Boulder Creek, CA 95006: Planetary Publications, P.O. Box 66, 1994:132.
- Kerr A. The Physiological Regulation of Salivary Secretions in Man. Oxford: Pergamon Press, 1961.
- Paddison S. The Hidden Power of the Heart. Boulder Creek, CA: Planetary Publications, 1992:280.
- Childre DL. Self Empowerment: The Heart Approach to Stress Management. Boulder Creek, CA: Planetary Publications, 1992.
- Wester M, AcqKnowledge, 1993, BIOPACK Systems, Inc: Goleta, CA 93117.
- Mancini G, Carbonara A and Hermans J. Immunochemical quantitation of antigens by single radial immunodiffusion. Immunochem 1965;2:235-239.
- Brandtzaeg P, Fjellanger I and Gferuldsen S. Human secretory immunoglobulins; Salivary secretions from individuals with normal or low levels of serum immunoglobulins. Scan J Haematol 1970;12:4-83.
- Bates J and Adams D. The influence of mental stress on the flow of saliva in men. Arch Oral Biol 1968;13:593-596.
- Kranz D, Manuck S and Wing R. Psychological stressors and task variables as elicitors of reactivity. In: Mathews D, Weiss S, and Detre T, Handbook of Stress, Reactivity and Cardiovascular Disease. NY: John-Wiley & Sons, 1986.
- Pillard R and Fisher S. Aspects of anxiety in dental clinic patients. J Am Dental Assoc 1970;80:1331-1334.
- Fuller BF. The effects of stress-anxiety and coping styles on heart rate variability. Int J Psychophysiol 1992;12:81-86.
- McCraty R, Atkinson M, Tiller WA, Rein G and Watkins A. The effects of emotions on short term power spectrum analysis of heart rate variability. American Journal of Cardiology, accepted July 1995.
- Quissell DO, Watson E and Dowd FJ. Signal transduction mechanisms involved in salivary gland regulated exocytosis. Crit Rev Oral Biol & Med 1992;3(1-2):83-107.
- Depelchin A and Letesson JJ. Adrenaline influence on the immune response; Accelerating or suppressor effects according to the time of application. Immunol Lett 1981;3:199-205.
- Mygind N and Thomsen J. Diurnal variation of nasal protein concentration. Acta Otolaryngol 1976;82:219-221.
- Passali D, Bellussi L and Lauriello M. Diurnal activity of the nasal mucosa. Acta Otolaryngol 1990;110:437-442.
- Rozman D, Whitaker R, Beckman T and Jones D. A new intervention program which significantly reduces psychological symptomatology in HIV-seropositive individuals. Psychosom 1994 (in press).
- Bercier JG and Frazier LW. The effect of aldosterone on phospholipid and phosphoinositide metabolism in rat submandibular gland. Arch Oral Biol 1993;38(5):393-398.
- Tornwall J, Uusitalo H and Konttinen YT. The distribution and origin of nerve fibers immunoreactive for substance P and neurokinin A in the anterior buccal gland of the rat. Cell Tiss Res 1994;277(2):309-313.
- Green M, Green R and Santoro W. Daily relaxation modifies serum salivary immunoglobulins and psychophysiologic symptom severity. Biofeedback and Self Regulat 1988;13:187-189.