
Heart Rate Variability: An Indicator of Self-Regulatory Capacity, Autonomic Function and Health
The autonomic nervous system (ANS) (Figure 1.1) is the part of the nervous system that controls the body’s internal functions, including heart rate, gastrointestinal tract and secretions of many glands. The ANS also controls many other vital activities such as respiration, and it interacts with immune and hormonal system functions. It is well known that mental and emotional states directly affect activity in the ANS.
The autonomic nervous system must be considered as a complex system in which both efferent (descending) and afferent (ascending) vagal (parasympathetic) neurons regulate adaptive responses. Considerable evidence suggests evolution of the ANS, specifically the vagus nerves, was central to development of emotional experience, the ability to self-regulate emotional processes and social behavior and that it underlies the social engagement system. As human beings, we are not limited to fight, flight, or freeze responses. We can self-regulate and initiate pro-social behaviors when we encounter challenges, disagreements and stressors. The healthy function of the social engagement system depends upon the proper functioning of the vagus nerves, which act as a vagal brake. This system underlies one’s ability to self-regulate and calm oneself by inhibiting sympathetic outflow to targets like the heart and adrenal glands. This implies that measurements of vagal activity could serve as a marker for one’s ability to self-regulate. This also suggests that the evolution and healthy function of the ANS determines the boundaries for the range of one’s emotional expression, quality of communication and the ability to self-regulate emotions and behaviors.[82]
Many of HMI’s research studies have examined the influence of emotions on the ANS utilizing analysis of heart rate variability/heart rhythms, which reflects heart-brain interactions and autonomic nervous system dynamics.[5, 83]
The investigation of the heart’s complex rhythms, or HRV began with the emergence of modern signal processing in the 1960s and 1970s and has rapidly expanded in more recent times.[84] The irregular behavior of the heartbeat is readily apparent when heart rate is examined on a beat-to-beat basis, but is overlooked when a mean value over time is calculated. These fluctuations in heart rate result from complex, nonlinear interactions among a number of different physiological systems (Figure 3.1).
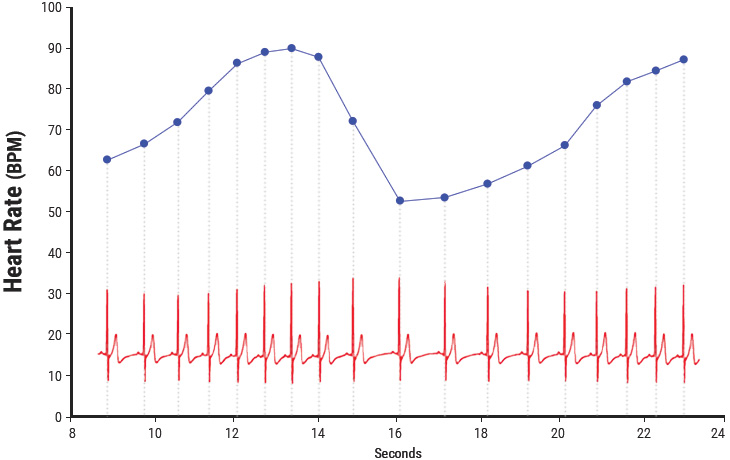
Figure 3.1 Heart rate variability is a measure of the normally occurring beat-to-beat changes in heart rate. The electrocardiogram (ECG) is shown on the bottom and the instantaneous heart rate is shown by the blue line. The time between each of the heartbeats (blue line) between 0 and approximately 13 seconds becomes progressively shorter and heart rate accelerates and then starts to decelerate around 13 seconds. This pattern of heart-rate accelerations and decelerations is the basis of the heart’s rhythms.
An optimal level of HRV within an organism reflects healthy function and an inherent self-regulatory capacity, adaptability, and resilience.[5, 58, 59, 85-88] While too much instability, such as arrhythmias or nervous system chaos, is detrimental to efficient physiological functioning and energy utilization, too little variation indicates age-related system depletion, chronic stress, pathology or inadequate functioning in various levels of self-regulatory control systems.[84, 89, 90]
The importance of HRV as an index of the functional status of physiological control systems was noted as far back as 1965, when it was found that fetal distress was preceded by reductions in HRV before any changes occurred in heart rate.[91] In the 1970s, reduced HRV was shown to predict autonomic neuropathy in diabetic patients before the onset of symptoms.[92-94] Reduced HRV also was found to be a higher risk factor of death post-myocardial infarction than other known risk factors.[ 95] It has been shown that HRV declines with age and that age-adjusted values should be used in the context of risk prediction.[96] Age-adjusted HRV that is low has been confirmed as a strong, independent predictor of future health problems in both healthy people and in patients with known coronary artery disease and correlates with all-cause mortality.[97, 98]
Based on indirect evidence, reduced HRV may correlate with disease and mortality because it reflects reduced regulatory capacity and ability to adapt/ respond to physiological challenges such as exercise. For example, in the Chicago Health, Aging and Social Relations Study, separate metrics for the assessment of autonomic balance and overall cardiac autonomic regulation were developed and tested in a sample of 229 participants. In this study, overall regulatory capacity was a significant predictor of overall health status, but autonomic balance was not. In addition, cardiac regulatory capacity was negatively associated with the prior incidence of myocardial infarctions. The authors suggest that cardiac regulatory capacity reflects a physiological state that is more relevant to health than the independent sympathetic or parasympathetic controls, or the autonomic balance between these controls as indexed by different measures of HRV.[99]
Heart rate variability also indicates psychological resiliency and behavioral flexibility, reflecting an individual’s capacity to self-regulate and effectively adapt to changing social or environmental demands.[99, 100] A growing number of studies have specifically linked vagally mediated HRV to self-regulatory capacity,[87, 88, 101] emotional regulation,[102, 103] social interactions,[86, 104] one’s sense of coherence[105] and the personality character traits of self-directedness[106] and coping styles.[107]
Self-Regulation: Cortical Systems
Considerable evidence from clinical, physiological and anatomical research has identified cortical, subcortical and medulla oblongata structures involved in cardiac regulation. Oppenheimer and Hopkins mapped a detailed hierarchy of cardiac control structures among the cortex, amygdala and other subcortical structures, all of which can modify cardiovascular-related neurons in the lower levels of the neuraxis (Figure 3.2).[117]
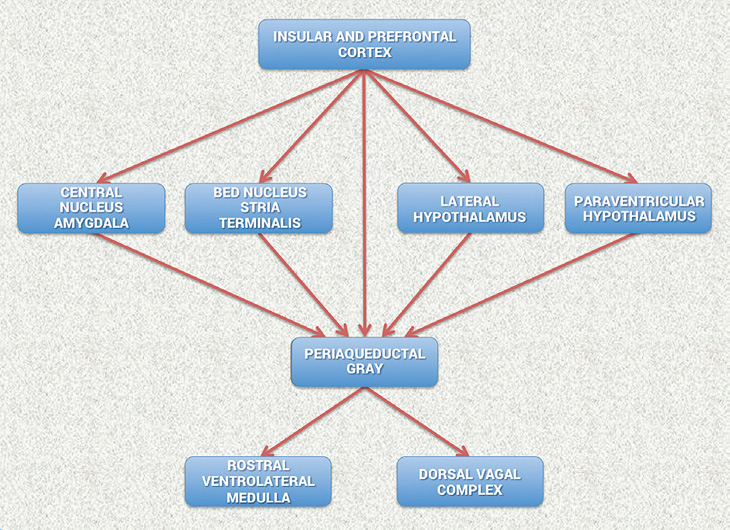
Figure 3.2 Schematic diagram showing the relationship of the principal descending neural pathways from the insular and prefrontal cortex to subcortical structures and the medulla oblongata as outlined by Oppenheimer and Hopkins.[117] The insular and prefrontal cortexes are key sites involved in modulating the heart’s rhythm, particularly during emotionally charged circumstances. These structures along with other centers such as the orbitofrontal cortex and cingulate gyrus can inhibit or enhance emotional responses. The amygdala is involved with refined integration of emotional content in higher centers to produce cardiovascular responses that are appropriate for the emotional aspects of current circumstances. Imbalances between the neurons in the insula, amygdala and hypothalamus may initiate cardiac rhythm disturbances and arrhythmias. The structures in the medulla represent an interface between incoming afferent information from the heart, lungs and other bodily systems and outgoing efferent neuronal activity.[117]
They suggest that the amygdala is involved with refined integration of emotional content in higher centers to produce cardiovascular responses that are appropriate for the emotional aspects of the current circumstances. The insular cortex and other centers such as the orbitofrontal cortex and cingulate gyrus can overcome (self-regulate) emotionally entrained responses by inhibiting or enhancing them. They also point out that imbalances between the neurons in the insula, amygdala and hypothalamus may initiate cardiac rhythm disturbances and arrhythmias. The data suggests that the insular and medial prefrontal cortexes are key sites involved in modulating the heart’s rhythm, particularly during emotionally charged circumstances.
Thayer and Lane also have described the same set of neural structures outlined by Oppenheimer and Hopkins, which they call the central autonomic network (CAN). The CAN is involved in cognitive, emotional and autonomic regulation, which they linked directly to HRV and cognitive performance. In their model, the CAN links the nucleus of tractus solitarius in the medulla with the insula, prefrontal cortex, amygdala and hypothalamus through a series of feedback and feedforward loops. They also propose that this network is an integrated system for internal self-regulation by which the brain controls the heart and other internal organs, neuroendocrine and behavioral responses that are critical for goal-directed behavior, adaptability and sustained health. They suggest that these dynamic connections explain why parasympathetically (vagal) mediated HRV is linked to higher-level executive functions and reflects the functional capacity of the brain structures that support working memory and emotional and physiological self-regulation. They have shown that higher levels of vagally mediated HRV are correlated with prefrontal cortical performance and the ability to inhibit unwanted memories and intrusive thoughts. The prefrontal cortex can be taken offline when individuals perceive that they are threatened, and prolonged periods of prefrontal cortical inactivity can lead to hypervigilance, defensiveness and social isolation. During these decreases in prefrontal cortical activation, heart rate (HR) increases and HRV decreases.[89]
- Thoughts and even subtle emotions influence the activity in the autonomic nervous system.
- The ANS interacts with our digestive, cardiovascular, immune, hormonal and many other bodily systems.
- Negative emotions/feelings create disorder in the brain’s regulatory systems and ANS.
- Feelings such as appreciation create increased order in the brain’s regulatory systems and ANS, resulting in improved hormonal- and immune-system function and enhanced cognitive function
The nucleus of tractus in the medulla oblongata integrates afferent sensory information from proprioceptors (body position), chemoreceptors (blood chemistry) and mechanoreceptors, also called baroreceptors, (pressure or distortion) from the heart, lungs and face. The nucleus of tractus connects to the dorsal motor nucleus of the vagus nerve and the nucleus ambiguus. Neurocardiology research indicates that the descending vagal fibers that innervate the heart are primarily A-fibers, which are the largest and fastest conducting axons that originate from nerve cells located primarily in the nucleus ambiguus. The nucleus ambiguus also receives and integrates information from the cortical and subcortical systems described above.[118] Thus, the vagal regulatory centers respond to peripheral sensory (afferent) inputs and higher brain-center inputs to adjust neuronal outflows, which results in the vagally mediated beat-to-beat changes in HR.
Increased efferent activity in the vagal nerves (also called the 10th cranial nerve) slows HR and increases bronchial tone. The vagus nerves are the primary nerves for the parasympathetic system and they innervate the intrinsic cardiac nervous system. A few of these connections synapse on motor neurons in the intrinsic cardiac nervous system and these neurons project directly to the SA node (and other tissues in the heart), where they trigger acetylcholine release to slow HR.[11] However, the majority of the efferent preganglionic vagal neurons (~80%) connect to local circuitry neurons in the intrinsic cardiac nervous system, where motor information is integrated with inputs from mechanosensory and chemosensory neurons in the heart.[119] Thus, efferent sympathetic and parasympathetic activity is integrated in and with the activity occurring in the heart’s intrinsic nervous system, including the input signals from the mechanosensory and chemosensory neurons within the heart, all of which ultimately contribute to beat-to-beat cardiac functional changes.[17]
In summary, the cardiorespiratory control system is complex and information from many inputs is integrated at multiple levels of the system, all of which are important for the generation of normal beat-tobeat variability in HR and BP. The medulla oblongata is the major structure integrating incoming afferent information from the heart, lungs and face with inputs from cortical and subcortical structures and is the source of the respiratory modulation of the activity patterns in sympathetic and parasympathetic outflow. The intrinsic cardiac nervous system integrates mechanosensitive and chemosensitive neuron inputs with efferent information from both the sympathetic and parasympathetic inputs from the brain, and as a complete system affects HRV, vasoconstriction and cardiac contractility in order to regulate HR and blood pressure.[120]
HRV and Analysis Methods
The normal variability in heart rate results from the descending (efferent) and the ascending (afferent) activity occurring in the two branches of the ANS, which act in concert, along with mechanical, hormonal and other physiological mechanisms to maintain cardiovascular parameters in their optimal ranges and to permit appropriate adjustments to changing external and internal conditions and challenges (Figure 1.3).
At rest, both sympathetic and parasympathetic nerves are tonically active, with the vagal effects predominant. Therefore, heart rate best reflects the relative balance between the sympathetic and parasympathetic systems. When speaking of autonomic balance, it should be kept in mind that a healthy system is constantly and dynamically changing. Therefore, an important indicator of the health status of the regulatory systems is that they have the capacity to respond to and adjust the relative autonomic balance, as reflected in heart rate, to the appropriate state for whatever a person is engaged in at any given moment. In other words, does the HR dynamically respond and is it higher in the daytime or when dealing with challenging tasks and lower when at rest or during sleep? Inability of the physiological self-regulatory systems to adapt to the current context and situation is associated with numerous clinical conditions.[121] Also, distinct, altered, circadian patterns in 24-hour heart rates are associated with different and specific psychiatric disorders, particularly during sleep.[122, 123]
Heart rate estimated at any given time represents the net effect of the neural output of the parasympathetic (vagus) nerves, which slows HR and the sympathetic nerves, which accelerate it. In a denervated human heart in which there are no connections from the ANS to the heart following its transplantation, the intrinsic rate generated by a pacemaker (SA node) is about 100 BPM.[124] Parasympathetic activity predominates when HR is below this intrinsic rate during normal daily activities and when at rest or sleep. When HR is above ~100 BPM, the relative balance shifts and sympathetic activity predominates. The average 24- hour HR in healthy people is ~73 BPM. Higher HRs are independent markers of mortality in a wide spectrum of conditions.[121]
It is important to note the natural relationship between HR and amount of HRV. As HR increases there is less time between heartbeats for variability to occur, so HRV decreases, while at lower HRs there is more time between heartbeats, so variability naturally increases. This is called cycle length dependence, and it persists in the healthy elderly to a variable degree, even at very advanced ages. However, elderly patients with ischemic heart disease or other pathologies increasingly have less variability as HRs decrease, ultimately losing the relationship between HR and variability – to the point that variability does not increase at all with reductions in HR.[125] Even in healthy subjects, the effects of cycle length dependence should be taken into account when assessing HRV, and HR values should always be reported, especially when HRs are increased because of factors such as stress reactions, medications and physical activity.
An increase in sympathetic activity is the principal method used to increase HR above the intrinsic level generated by the SA node. Activation of this branch of the ANS, in concert with the activation of the endocrine system, facilitates the ability to respond to challenges, stressors or threats by increasing the mobilization of energy resources.
Following the onset of sympathetic stimulation, there is a delay of up to 5 seconds before the stimulation induces a progressive increase in HR, which reaches a steady level in 20 to 30 seconds if the stimulus is continuous.[120] The relatively slow response to sympathetic stimulation is in direct contrast to vagal stimulation, which is almost instantaneous. However, the effect of sympathetic stimulation on HR is longerlasting and even a brief stimulus can affect HR for 5 to 10 seconds. Efferent (descending) sympathetic nerves target the SA node via the intrinsic cardiac nervous system and the bulk of the myocardium (heart muscle). Action potentials conducted by these motor neurons trigger norepinephrine and epinephrine release, which increases HR and strengthens the contractility of the atria and ventricles.
HRV can be assessed with various analytical approaches, although the most commonly used are frequency domain (power spectral density) analysis and time domain analysis. In both methods, the time intervals between each successive normal QRS complex are first determined. All abnormal beats not generated by the sinus node are eliminated from the record. The interactions between autonomic neural activity, BP, respiratory and higher-level control systems produce both short- and long-term rhythms in HRV measurements.[5, 126, 127] The most common form for observing these changes is the heart-rate tachogram, a plot of the sequence of time intervals between heartbeats (Figure 3.3).
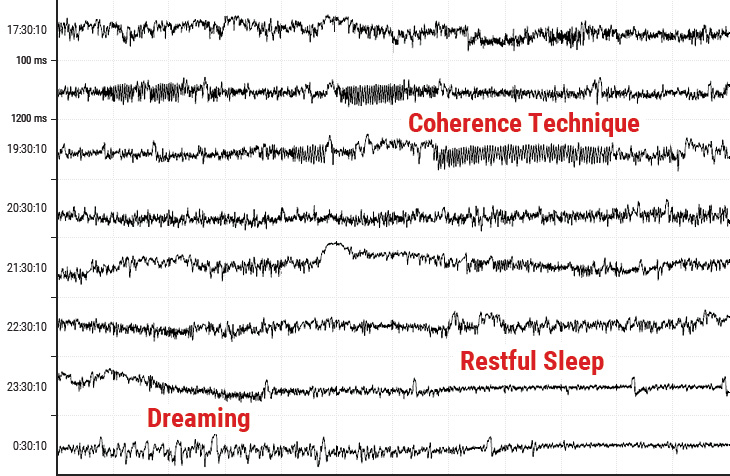
Figure 3.3 An example of the heart-rate tachogram, a plot of the sequence of time intervals between heartbeats over an 8-hour period in ambulatory recording taken from a 36-year-old male. Each of the traces is one hour long, with the starting time of the hour on the left-hand side of the figure. The time between each vertical line is 5 minutes. The vertical axis within each of the hourly tracings is the time between heartbeats (interbeat intervals) ranging from 400 tp 1,200 milliseconds (label shown on second row). A 15-minute period of HRV coherence can be seen in the latter part of the hour, starting at 19:30 when this man practiced HeartMath’s Heart Lock-In® Technique. The latter part of the hour, starting at 23:30, is typical of restful sleep.
Power spectral analysis is used to separate the complex HRV waveform into its component rhythms (Figure 3.4). Spectral analysis provides information about how power is distributed (the variance and amplitude of a given rhythm) as a function of frequency (the time period of a given rhythm). The main advantages of spectral analysis over the time domain measures are that it supplies both frequency and amplitude information on the specific rhythms that exist in the HRV waveform, providing a means to quantify these oscillations over any given period. The values are expressed as the power spectral density, which is the area under the curve (peak) in a given bandwidth of the spectrum. The power or height of the peak at any given frequency indicates the amplitude and stability of the rhythm. The frequency reflects the period of time over which the rhythm occurs. For example, a 0.1 hertz frequency has a period of 10 seconds. In order to understand how power spectral analysis distinguishes the various underlying physiological mechanisms reflected in the heart’s rhythm, a brief discussion of the underlying physiological mechanisms is helpful.
The power spectrum is divided into three main frequency ranges.
High-Frequency Band
The high-frequency (HF) spectrum is the power in the range from 0.15 to 0.4 hertz, which equates to rhythms with periods that occur between 2.5 and 7 seconds. This band reflects parasympathetic or vagal activity and is frequently called the respiratory band because it corresponds to the HR variations related to the respiratory cycle known as respiratory sinus arrhythmia. The mechanisms linking the variability of HR to respiration are complex and involve both central and reflex interactions.[118] During inhalation, the cardiorespiratory center inhibits vagal outflow, resulting in speeding up HR. Conversely, during exhalation, vagal outflow is restored, resulting in slowing HR.[128] The magnitude of the oscillation is variable, but in healthy people, it can be increased by slow, deep breathing.
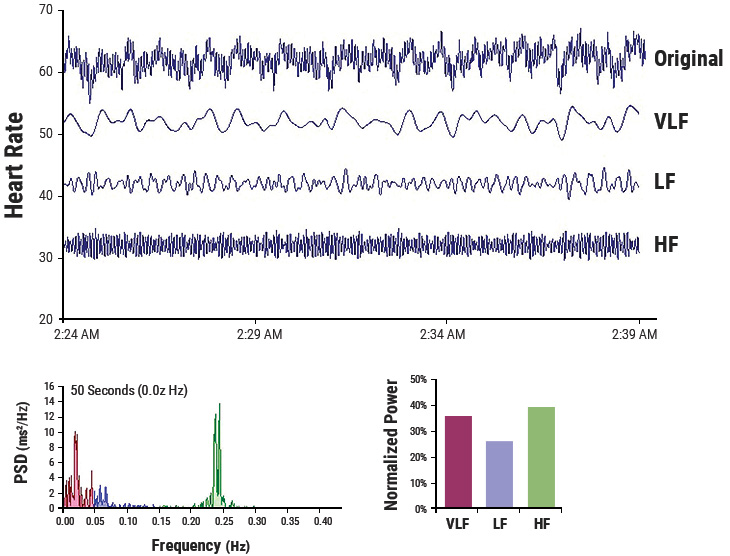
Figure 3.4 This figure shows a typical HRV recording over a 15-minute period during resting conditions in a healthy individual. The top trace shows the original HRV waveform. Filtering techniques were used to separate the original waveform into VLF, LF, and HF bands as shown in the lower traces. The bottom of the figure shows the power spectra (left) and the percentage of power (right) in each band.
Reduced parasympathetic (HF) activity has been found in a number of cardiac pathologies as discussed earlier. In terms of psychological regulation, reduced vagally mediated HRV has been linked to reduced self-regulatory capacity and cognitive functions that involve the executive centers of the prefrontal cortex. This is consistent with the finding that lower HF power is associated with stress, panic and anxiety/worry. Lower parasympathetic activity, rather than reduced sympathetic functioning, appears to account for a higher ratio of the reduced HRV in aging.[96]
Low-Frequency Band
The low-frequency (LF) band ranges between 0.04 and 0.15 hertz, which equates to rhythms or modulations with periods that occur between 7 and 25 seconds. This region was previously called the baroreceptor range or midfrequency band by many researchers because it primarily reflects baroreceptor activity while at rest.[129] As discussed previously, the vagus nerves are a major conduit through which afferent neurological signals from the heart are relayed to the brain, including baroreflex signals. Baroreceptors are stretch-sensitive mechanoreceptors located in the chambers of the heart and vena cavae, carotid sinuses (which contain the most sensitive mechanoreceptors) and the aortic arch. Baroreflex gain is commonly calculated as the beat-to-beat change in HR per unit of change in BP. Decreased baroreflex gain is related to aging and impaired regulatory capacity.
The existence of a cardiovascular system resonance frequency, which is caused by the delay in the feedback loops in the baroreflex system, has long been established. When the cardiovascular system oscillates at this frequency, there is a distinctive highamplitude peak in the HRV power spectrum around 0.1 hertz. Most mathematical models show that the resonance frequency of the human cardiovascular system is determined by the feedback loops between the heart and brain.[130, 131] In humans and many other mammals, the resonance frequency of the system is approximately 0.1 hertz, equivalent to a 10-second rhythm, which is also characteristic of the coherent state described earlier.
The sympathetic nervous system does not appear to have much influence in rhythms above 0.1 hertz, while the parasympathetic system can be observed to affect heart rhythms down to 0.05 hertz (20-second rhythm). Therefore, during periods of slow respiration rates, vagal activity can easily generate oscillations in the heart rhythms that cross over into the LF band.[111, 132, 133] Thus, respiratory-related efferent vagally mediated influences are particularly present in the LF band when respiration rates are below 8.5 breaths per minute/7-second periods or when an individual sighs or takes a deep breath.[133, 134]
In ambulatory 24-hour HRV recordings, it has been suggested that the LF band reflects sympathetic activity and the LF/HF ratio has been used, controversially so, to assess the balance between sympathetic and parasympathetic activity.[135-137] A number of researchers have challenged this perspective and have persuasively argued that in resting conditions, the LF band reflects baroreflex activity and not cardiac sympathetic innervation.[40, 71, 96, 105-107]
The perspective that the LF band reflects sympathetic activity comes from observations of 24-hour ambulatory recordings in which there are frequent sympathetic activations primarily resulting from physical activity, but also emotional reactions, which can create oscillations in the heart rhythms that cross over from the VLF band into the lower region of the LF band. In long-term ambulatory recordings, the LF band fairly approximates sympathetic activity when increased sympathetic activity occurs.[138] Unfortunately, some authors have assumed that this interpretation also is true of short-term resting recordings and have confused slower breathing-related increases in LF power with sympathetic activity, when in reality it is almost entirely vagally mediated.
Very-Low-Frequency Band
The very-low-frequency band (VLF) is the power in the HRV power spectrum range between 0.0033 and 0.04 hertz which equates to rhythms or modulations with periods that occur between 25 and 300 seconds. Although all 24-hour clinical measures of HRV reflecting low HRV are linked with increased risk of adverse outcomes, the VLF band has stronger associations with all-cause mortality than LF and HF bands.[98, 139-141] Low VLF power has been shown to be associated with arrhythmic death[142] and PTSD.[143] Additionally, low power in this band has been associated with high inflammation[144, 145] in a number of studies and has been correlated with low levels of testosterone, while other biochemical markers, such as those mediated by the HPA axis (e.g., cortisol), have not.[146] Longer time periods using 24-hour HRV recordings should be obtained to provide comprehensive assessment of VLF and ULF fluctuations.[147]
Historically, the physiological explanation and mechanisms involved in the generation of the VLF component have not been as well defined as the LF and HF components. This region has been largely ignored even though it is the most predictive of adverse outcomes. Long-term regulation mechanisms and ANS activity related to thermoregulation, the renin-angiotensin system and other hormonal factors appear to contribute to this band.[148, 149] Recent work by Dr. J. Andrew Armour has shed new light on the mechanisms underlying the VLF rhythm and suggests that we have to reconsider both the mechanisms and importance of this band.
This line of research began after some surprising results from a study looking at HRV in autotransplanted hearts in dogs. In autotransplants, the heart is removed and placed back in the same animal, so there is no need for anti-rejection medications. The primary purpose of the study was to determine if the autonomic nerves reinnervated the heart posttransplant. Monthly 24-hour HRV recordings were done over a one-year period on all of the dogs with autotransplanted hearts as well as control dogs. It turned out that the nerves did reinnervate, but in a way that was not accurately reflected in HRV. It was shown that the intrinsic cardiac nervous system had neuroplasticity and restructured its neural connections. The truly surprising result was that these deinnervated hearts had higher levels of HRV than the control dogs immediately post-transplant and these levels were sustained over a one-year period, including HRV, which typically is associated with respiration (Figure 3.5).[150] This was unexpected because in human transplant recipients, there is very little HRV.[151]
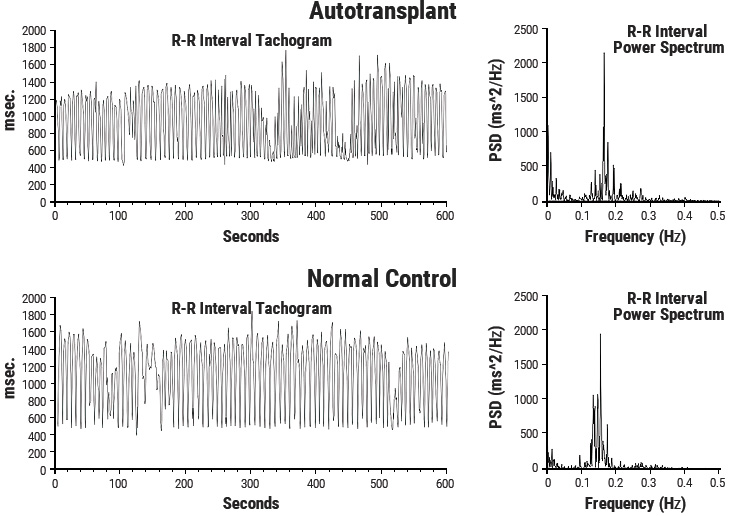
Figure 3.5 Heart Rhythms Generated by a Transplanted Heart. At top left is the heart-rate tachogram of a dog after undergoing cardiac autotransplantation, with the accompanying top-right graph showing the HRV power spectrum. For comparison, the bottom graphs show the heart-rate tachogram and HRV power spectrum of a normal dog. Note the similarity between the two.
Following up on these results, Armour and colleagues developed methods for obtaining long-term singleneuron recordings from a beating heart and, simultaneously, from extrinsic cardiac neurons.[13] This work, combined with later findings by Kember and Armour, implies that the VLF rhythm is generated by the stimulation of afferent sensory neurons in the heart, which in turn activates various levels of the feedback and feed-forward loops in the heart’s intrinsic cardiac nervous system, as well as between the heart and neurons in the extrinsic cardiac ganglia and spinal column.[152, 153] Thus, the VLF rhythm appears to be produced by the heart itself and is an intrinsic rhythm that appears to be fundamental to health and wellbeing. Armour has observed that when the amplitude of the VLF rhythm at the neural level is diminished in an animal research subject, the animal is in danger and will expire shortly if the research procedures proceed. This cardiac origin of the VLF rhythm also is supported by studies showing that sympathetic blockade does not affect VLF power and VLF activity remains in tetraplegics, whose sympathetic innervation of the heart and lungs is disrupted.[154]
Circadian rhythms, core body temperature, metabolism, hormones and intrinsic rhythms generated by the heart all contribute to lower-frequency rhythms (e.g., very-low-frequency and ultra-low-frequency rhythms) that extend below 0.04 hertz. In healthy individuals, there is an increase in VLF power that occurs during the night and peaks before waking.[155,156] This increase in autonomic activity appears to correlate with the morning cortisol peak.
To summarize, experimental evidence suggests the VLF rhythm is intrinsically generated by the heart and the amplitude and frequency of these oscillations are modulated by efferent sympathetic activity. Normal VLF power appears to indicate healthy function, and increases in resting VLF power and/or shifting of frequency can reflect efferent sympathetic activity. The modulation of the frequency of this rhythm resulting from physical activity,[157] stress responses and other factors that increase efferent sympathetic activation can cause it to cross over into the lower region of the LF band during ambulatory monitoring or during short-term recordings when there is a significant emotional stressor.[5]
Time Domain Measurements of HRV
Time domain indices quantify the amount of variance in the interbeat interval (IBI) using statistical measures. Time domain measures are the simplest to calculate. Time domain measures do not provide a means to adequately quantify autonomic dynamics or determine the rhythmic or oscillatory activity generated by the different physiological control systems. However, since they are always calculated the same way, data collected by different researchers are comparable, but only if the recordings are exactly the same length of time and the data are collected under the same conditions. The three most important and commonly reported time domain measures are the SDNN, the SDNN index, and the RMSSD.
SDNN
The SDNN is the standard deviation of the normalto- normal (NN) sinus-initiated interbeat-intervals measured in milliseconds. This measure reflects the ebb and flow of all the factors that contribute to HRV. In 24-hour recordings, the SDNN is highly correlated with ULF and total power.[96] In short-term resting recordings, the primary source of the variation is parasympathetically mediated, especially with slow, deep-breathing protocols. However, in ambulatory and longer-term recordings the SDNN values are highly correlated with lower-frequency rhythms.[83] Thus, low age-adjusted values predict morbidity and mortality. For example, patients with moderate SDNN values (50-100 milliseconds) have a 400% lower risk of mortality than those with low values (0-50 milliseconds) in 24-hour recordings.[158, 159]
SDNN Index
The SDNN index is the mean of the standard deviations of all the NN intervals for each 5-minute segment. Therefore, this measurement only estimates variability due to the factors affecting HRV within a 5-minute period. In 24-hour HRV recordings, it is calculated by first dividing the 24-hour record into 288 five-minute segments and then calculating the standard deviation of all NN intervals contained within each segment. The SDNN Index is the average of these 288 values.[90] The SDNN index is believed to primarily measure autonomic influence on HRV. This measure tends to correlate with VLF power over a 24-hour period.[83]
RMSSD
The RMSSD is the root mean square of successive differences between normal heartbeats. This value is obtained by first calculating each successive time difference between heartbeats in milliseconds. Each of the values is then squared and the result is averaged before the square root of the total is obtained. The RMSSD reflects the beat-to-beat variance in heart rate and is the primary time domain measure used to estimate the vagally mediated changes reflected in HRV.[90] The RMSSD is correlated with HF power and therefore also reflects self-regulatory capacity, as discussed earlier.[83]
HRV Assessment Services
The Autonomic Assessment Report, (AAR), developed by the HeartMath Research Center, provides physicians, researchers and mental health-care professionals with a diagnostic tool to detect abnormalities and imbalances in the autonomic nervous system and predict those at increased risk of developing various pathologies often before symptoms become manifest. The HeartMath Research Center provides this analysis service to physicians and medical institutions throughout the U.S. and abroad.
The Autonomic Assessment Report is a powerful tool for quantifying autonomic function. The AAR provides health-care professionals and researchers with a noninvasive test that quantifies autonomic function and relative balance and risk stratification, and assesses the effects of interventions on autonomic function. The AAR is derived from 24-hour ambulatory ECG recordings, typically obtained with an "HRV" recorder, which is inexpensive, lightweight and comfortable to wear. The AAR is based on analysis of heart rate variability, which provides a unique window into the interactions of sympathetic and parasympathetic control of the heart. The report includes time domain, frequency domain and circadian rhythm analysis, which together constitute a comprehensive analysis of autonomic activity, relative balance and rhythms. Time domain measures include the mean normalto- normal (NN) intervals during a 24-hour recording and statistical measures of the variance between NN intervals. Power spectral density analysis is used to assess how power is distributed as a function of frequency, providing a means to quantify autonomic balance at any given point in the 24-hour period, as well as to chart the circadian rhythms of activity in the two branches of the autonomic nervous system. HMI has established and maintains an extensive HRV database of healthy individuals that greatly increases the AAR’s value as a diagnostic and risk-assessment tool. Additionally, the age and gender normative values are provided for each time and frequency domain HRV value.
HRV is useful for monitoring autonomic function and assessing ANS involvement in a number of clinical conditions. Importantly, low HRV has been found to be predictive of increased risk of heart disease, sudden cardiac death as well as all-cause mortality.
Autonomic Function Imbalances Are Associated With:
- Depression
- Hypoglycemia
- Panic Disorder
- Sleep Disorder
- Asthma
- Fatigue
- Dizziness
- Nausea
- Irritable Bowel
- Fibromyalgia
- Hypertension
- Chemical Sensitivity
- Premenstrual Syndrome
- Anxiety
- Migraine
- Arrhythmia
Autonomic imbalances have been implicated in a wide variety of pathologies, including depression, fatigue, premenstrual syndrome, hypertension, diabetes mellitus, ischemic heart disease, coronary heart disease and environmental sensitivity. Stress and emotional states have been shown to dramatically affect autonomic function. Self-regulation techniques, which enable individuals to gain greater control of their mental and emotional stress and improve their autonomic functioning, can significantly affect a wide variety of disorders in which autonomic imbalance plays a role. The AAR analysis is highly useful for the quantitative demonstration of the effects of HeartMath interventions in restoring healthy autonomic function in many patients who have been able to significantly improve their symptomatology and psychological well-being through practice of these techniques.
The Autonomic Assessment Report Interpretation Guide and Instructions booklet, available from HMI, provides clinicians with understandable descriptions of HRV measures used in the report and how to interpret them in clinical applications. It includes a number of case histories and clinical examples.
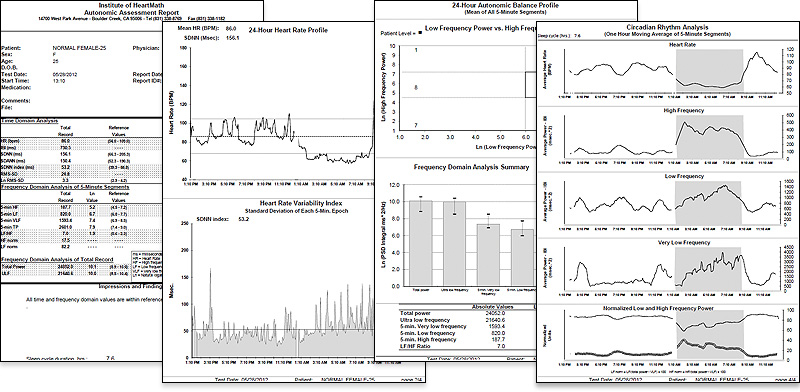
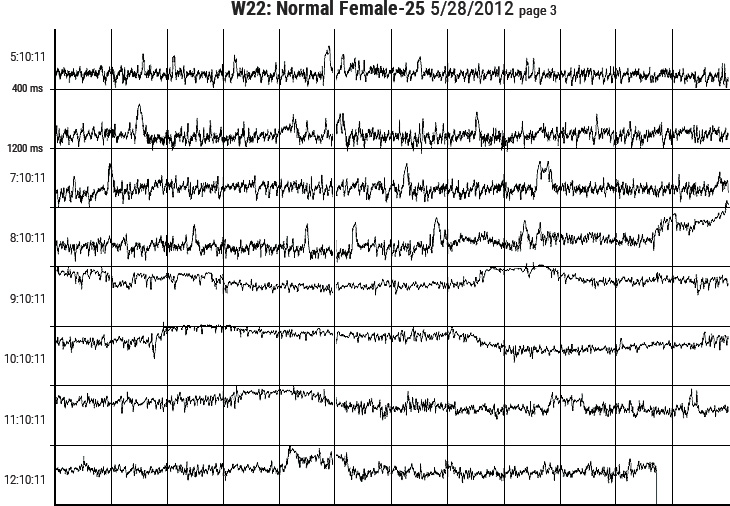
Figure 3.6 Sample pages from the HeartMath Autonomic Assessment Report. Shown from top left to right are: (1) Summary page with normative reference ranges. (2) 24-Hour Heart Rate Profile and Heart Rate Variability Index plot. (3) Autonomic Balance Profile and frequency domain analysis summary. (4) Circadian Rhythm Analysis page and bottom graph. (5) One page of the three heart-rate tachogram pages showing HRV from the full 24-hours.